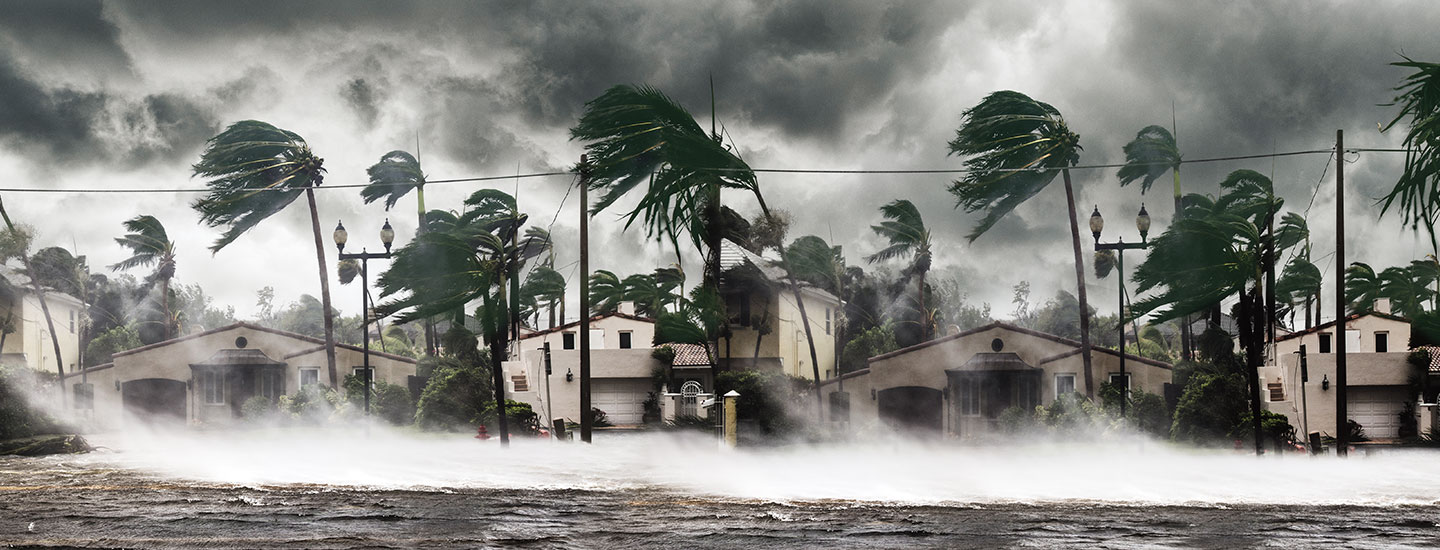
Hurricane passing through a town

Shutterstock.com (All Images)

STANDARDS

CCSS: 6.SP.B.5, MP1, MP3, MP5

TEKS: 6.12A, 6.12B, 6.12C

Naming Hurricanes

Last year, scientists ran out of hurricane names, but it won’t happen again

The 2020 Atlantic hurricane season was intense. Last year, the Atlantic Ocean spawned more named storms than any year on record. There were so many storms that meteorologists used all 21 names on their alphabetical list. As more storms formed, they switched to letters of the Greek alphabet, naming storms Alpha and Beta—all the way up to Iota.

This year, they’re prepared with a backup list, for a total of 42 names. Phil Klotzbach, a scientist who forecasts hurricanes, says it is unlikely we will ever exceed 42 named storms. “We don’t expect to see overall more hurricanes,” he says, “just potentially stronger ones.”

Every year, meteorologists come up with 21 names to identify Atlantic hurricanes. Each one starts with a different letter of the alphabet. But in 2020, the Atlantic Ocean saw more named storms than any year on record. There were so many that meteorologists ran out of names on their list. As more storms formed, they switched to letters of the Greek alphabet. They named storms Alpha, Beta, Gamma, and more.

This year, they’re prepared with a backup list. They have 42 names in total. Phil Klotzbach, a scientist who forecasts hurricanes, says they are unlikely to ever need more. “We don’t expect to see overall more hurricanes,” even with climate change, he says. “Just potentially stronger ones.”

The 2020 Atlantic Hurricane season had 30 named storms. The regular list of 21 names was exhausted on September 17. There were 9 storms named with letters of the Greek alphabet.

It took many years to devise this system. In the 1700s, people referred to hurricanes by the places or ships they destroyed. Spanish explorers named storms after saints according to the Roman Catholic calendar. Until the early 1950s, U.S. meteorologists identified storms with the year and the order in which they developed. This awkwardness was often avoided by using nicknames. During World War II, Navy meteorologists would sometimes name hurricanes after their wives or unpopular public figures. Eventually, scientists realized they needed a standardized system.

Since 1953, Atlantic storms have been named from lists created by the National Hurricane Center. Today, the UN’s World Meteorological Organization (WMO) maintains and updates that list. At first, all the names were feminine, but in the late 1970s, masculine names were added. Today, Atlantic storms with sustained winds over 39 miles per hour are named in alphabetical order, alternating masculine and feminine. English, French, and Spanish names are used to reflect the diversity of affected countries. Letters Q, U, X, Y, and Z are not included. Names are usually recycled every six years, but the WMO retires the names of especially devastating hurricanes, like Katrina, Harvey, and Maria.

Scientists forecast another active hurricane season this year. Is your name on the list?

Naming storms alphabetically is a modern practice. In the 1700s, people often named hurricanes after places and ships the storms destroyed. Spanish explorers used the names of Roman Catholic saints. U.S. meteorologists used to identify storms by the year and the order in which they developed. But this could be confusing, so people often used nicknames. During World War II, Navy meteorologists sometimes named hurricanes after their wives or unpopular public figures. Scientists realized they needed a new system. 

Since 1953, meteorologists have used an alphabetical list of names for Atlantic storms. Today, the World Meteorological Organization (WMO) is in charge of the list. At first, all the names on the list were feminine. But in the late 1970s, masculine names were added.

An Atlantic storm receives a name if its winds exceed 39 miles per hour. Names are assigned in alphabetical order, alternating masculine and feminine. English, French, and Spanish names are used to reflect the diversity of the countries affected by hurricanes. There are no names beginning with the letters Q, U, X, Y, or Z. Names are usually recycled every six years. But if a hurricane is especially devastating, the WMO retires its name forever. That happened with Hurricanes Katrina, Harvey, and Maria.

Scientists forecast another active hurricane season this year. Is your name on the list?

Use the stem-and-leaf plots below to answer the following questions about named Atlantic storms since 2001. Record your work and answers on our answer sheet.

Use the stem-and-leaf plots below to answer the following questions about named Atlantic storms since 2001. Record your work and answers on our answer sheet.

The stem-and-leaf plot below shows the number of named Atlantic storms from 2001 to 2010.

The stem-and-leaf plot below shows the number of named Atlantic storms from 2001 to 2010.

A. What was the lowest number of storms in this time period? The highest?

A. What was the lowest number of storms in this time period? The highest?

B. Estimate the mean number of storms during this time period.

B. Estimate the mean number of storms during this time period.

C. What visual clues in the stem-and-leaf plot helped you make your estimate?

C. What visual clues in the stem-and-leaf plot helped you make your estimate?

D. Calculate the actual mean. How close was your estimate?

D. Calculate the actual mean. How close was your estimate?

The stem-and-leaf plot below shows the number of named Atlantic storms from 2011 to 2020.

The stem-and-leaf plot below shows the number of named Atlantic storms from 2011 to 2020.

A. What’s the median of this data set?

A. What’s the median of this data set?

B. Which stem, or tens place value, had no named storms in this time period?

B. Which stem, or tens place value, had no named storms in this time period?

A.  Without doing the math, which of the two decades shown in the plots do you think had more storms? Does the stem-and-leaf plot provide any visual clues?

A.  Without doing the math, which of the two decades shown in the plots do you think had more storms? Does the stem-and-leaf plot provide any visual clues?

B. Calculate the total number of storms in each data set. Was your guess correct?

B. Calculate the total number of storms in each data set. Was your guess correct?

Use what you learned to combine these stem-and-leaf plots into one that covers the time span of 2001 through 2020. What do you notice about the data set? What would you want to research further?

Use what you learned to combine these stem-and-leaf plots into one that covers the time span of 2001 through 2020. What do you notice about the data set? What would you want to research further?

videos (1)
Skills Sheets (4)
Skills Sheets (4)
Skills Sheets (4)
Skills Sheets (4)
Lesson Plan (2)
Lesson Plan (2)
Article (1)
Text-to-Speech