STANDARDS

CCSS: 6.SP.B.4, 6.SP.B.5, 7.SP.B.3, 8.SP.A.1, MP1, MP5, MP6

TEKS: 6.12A, 6.12B, 6.12C, 6.12D, 6.13A, 7.6G, 7.12A, 8.5C, 8.11A

Solar Power Boom

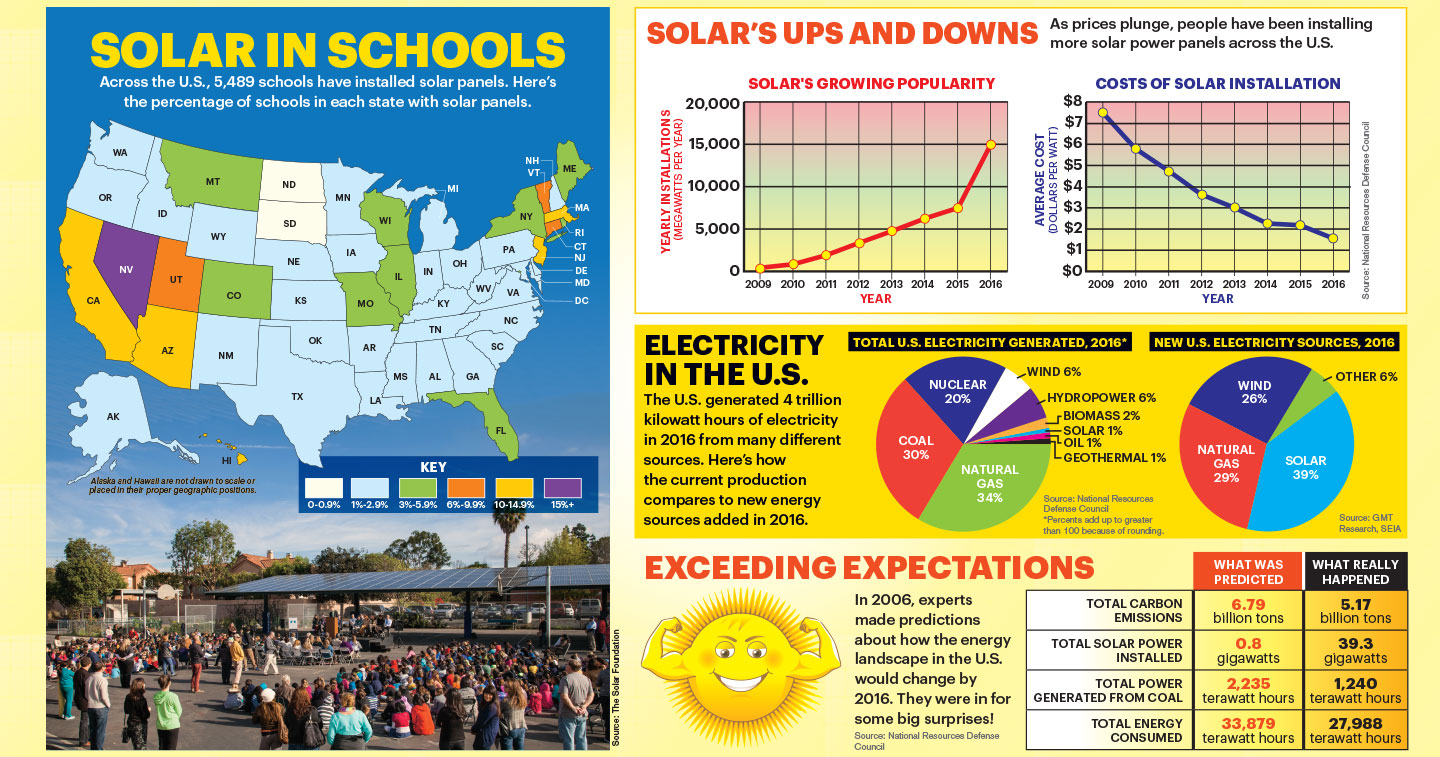
When seventh-grader Claire Vlases first proposed putting solar panels on the roof of her school, people were skeptical. “It seemed like a wild idea,” she says. Solar panels capture energy from the sun’s rays and turn it into electricity. Two years later, Sacajawea Middle School in Bozeman, Montana, is one of more than 5,000 schools in the U.S. running on solar energy.

It’s not just schools that are going solar. People are turning to solar panels to power homes, businesses, and more. As a result, solar technology is now the fastest growing energy source in the world.

“This is something no one predicted,” says Amanda Levin of the Natural Resources Defense Council in Washington, D.C. In 2006, experts estimated that within 10 years, the U.S. would have enough solar panels to generate 0.8 gigawatts of electricity. That’s enough power for about 300,000 homes. But by 2016 there were enough panels installed to generate 39.3 gigawatts!

The main reason for solar power’s surprising rise, Levin says, is cost. Since 2009, the price of installing solar panels has fallen dramatically. That makes solar energy competitive with other energy sources, like coal, that pollute the environment. “It means we can continue to have growth and prosperity while also making our air healthier,” Levin says.

Claire, now in ninth grade, raised more than $120,000 to install solar panels on her high school. She plans to put panels on local elementary schools with any extra cash. “Solar just makes sense,” she says.

Jim McMahon/Mapman (Map); Citizen of the Planet/Education Images/UIG via Getty Images (Solar Panels); iStockPhoto/Getty Images (Sun)

Answer the following questions using the information in the charts and graphs above. Record your work and answers on our answer sheet.

Which energy source generated the most electricity in 2016?

A) natural gas

B) nuclear

C) coal

D) solar

Between which two years was the greatest increase in solar installations?

A) 2010-11

B) 2012-13

C) 2014-15

D) 2015-16

How many states have at least 6% of their schools equipped with solar panels?

A) 5

B) 9

C) 15

D) 23

What was the average price of solar panel installation per watt in 2013?

A) $2 per watt

B) $3 per watt

C) $4 per watt

D) $5 per watt

How many fewer tons of carbon emissions were released in 2016 than were predicted in 2006?

A) 0.62 billion

B) 1.32 billion

C) 1.62 billion

D) 2.02 billion

About how many times more solar power was installed in 2016 than was predicted in 2006? Round your answer to the nearest whole number.

A) 24

B) 36

C) 49

D) 55

About how many kilowatt hours of electricity were produced by solar power, wind power, and hydropower in 2016?

Describe how the predicted total energy consumption in 2016 compared to what happened.  

There are about 1,150 schools in Utah. What is the range of the number of schools in Utah that have solar panels installed?

Compare the trend of solar power installation with the trend of the cost.

videos (1)
Skills Sheets (1)
Lesson Plan (1)
Text-to-Speech